DuckDB VS Porto buses - A small case for a new OLAP engine
21 November 2022
8 minutes to read
For the last couple of years a new database system, DuckDB, has risen in popularity and I’ve been looking into playing with it for some time. For data engineers that got used to either Postgres or data warehouses like Redshift (when I was not the one paying for it 😅) this new entrant seems very promising.
Duck what?
So what is DuckDB? If we go to their page we’re presented with “DuckDB is an in-process SQL OLAP database management system”. In other words, this means that we can interact and analyze data in different environments by calling an executable file on a shell or by installing a Python package. For analysis that can reside on a single computer, it states to be very performant and, with the addition of built-in tools to read from CSV, Parquet, or even postgres tables, it’s turning into the goto tool for data analysis, replacing the need for Python/R, or a somewhat painful process of bootstrapping a database. So, let’s put it to the test!
Note: Another great feature I’d like to add but we won’t be testing in this article is the easiness of importing and exporting pandas dataframes, one of the features making it so popular in the Python community. With this said, let’s give it a try!
How can I install?
For this article, I’m testing with a Macbook Pro M1 and will be running version 0.6.0. To install it you can do as below:
wget https://github.com/duckdb/duckdb/releases/download/v0.6.0/duckdb_cli-osx-universal.zip

unzip duckdb_cli-osx-universal.zip
We can now use DuckDB by simply running on the terminal we unzipped ./duckdb. However, we can do one better and make the DB available system-wide on MacOs by running the Homebrew command brew install duckdb.
Let’s test it with some local data
For this test, I’ll take the opportunity and analyze the schedule of my local public bus (Porto, Portugal 🇵🇹). Luckily for us, the municipal chamber has an open data portal where we can find a dataset with exactly what we need (⚠️ the portal is in Portuguese).
We proceed to transfer it by clicking on the transfer button or you can run the following commands:
wget https://opendata.porto.digital/dataset/5275c986-592c-43f5-8f87-aabbd4e4f3a4/resource/1f845744-1962-4108-a20c-ac3357d0957b/download/gtfs-stcp.zip

unzip gtfs-stcp.zip
The zip contains 9 files:
- routes.txt
- calendar.txt
- stops.txt
- trips.txt
- shapes.txt
- stop_times.txt
- calendar_dates.txt
- agency.txt
- transfers.txt
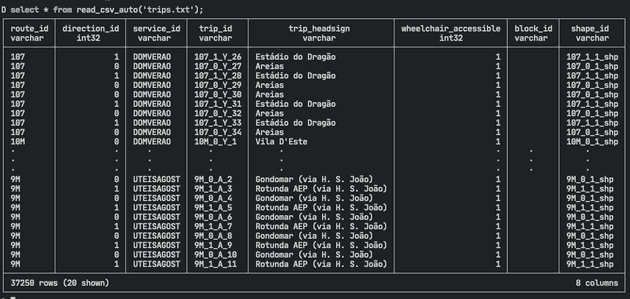
Although they are txt files, after opening them we can see that they follow a CSV format. This is great as we can utilize one of DuckDB native functions and read the data directly from the files using read_csv_auto.
This is a nice feature but we don’t want to import the files each time we run a query. So, the next step is to create a table for each file:
create table routes as select * from read_csv_auto('routes.txt');
create table calendar as select * from read_csv_auto('calendar.txt');
create table stops as select * from read_csv_auto('stops.txt');
create table trips as select * from read_csv_auto('trips.txt');
create table shapes as select * from read_csv_auto('shapes.txt');
create table stop_times as select * from read_csv_auto('stop_times.txt');
create table calendar_dates as select * from read_csv_auto('calendar_dates.txt');
create table transfers as select * from read_csv_auto('transfers.txt');

-- For some reason this file requires the additional parameter to detect the headers
create table agency as select * from read_csv_auto('agency.txt' , header=True);
After running this command, you can check the tables you created with show tables.
Neat 🤌🏼 But…
What would happen if you close the shell or the computer shut down? Well, we’d lose everything sadly. To solve this, DuckDB can store all data by creating a single *.duckdb file (very similar to how SQLite works). This has the downside of not allowing concurrent writers (only readers are permitted) but for our use case, it’s not something to bother us.
So, for us to advance in our test we’ll execute .open main.duckdb. This command either opens an existing file in the current directory or creates a new one. From this point on, everything you do is stored for all eternity. Or until you delete the file. Or the hard drive goes kaboom. Whatever comes first 🧨.
This reminds me that if you run show tables again, you’ll see that the tables you created don’t exist anymore 😅. This is because up until we run .open, we were storing everything in memory. You need to run the commands above again and from this point one, everytime you close the shell you can open the database by running duckdb preceded by the name of the file.
Simple and clean, don’t you think?
What can we do with duckDB?
With the steps above, we can proceed to analyze our dataset. For this test, I came up with 2 questions:
- How many routes do we have? And stops per route?
- What is the frequency of the buses?
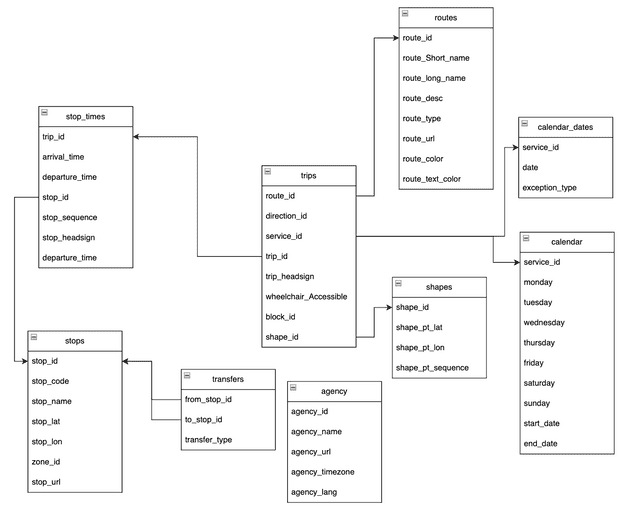
To answer these we should first check the schema of our tables (for this article I draw this one manually).
How many routes do we have? And stops per route?
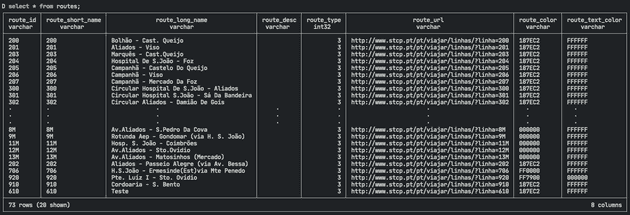
For this first question, we can check the table routes with a select statement.
The first column is named a route_id which, if unique, will correctly point us to how many lines we have. For that we run both queries:
select count(*) from routes;

select count(distinct route_id) from routes;
Both return 73 so we can safely say that in Porto there are 73 routes. But how many stops do we have per line?
create table route_stops as
with stops_routes as (

    select distinct (
    routes.route_short_name,
    stop_times.stop_id) as routes
    from
        trips
    inner join routes
        on trips.route_id = routes.route_id
    inner join stop_times
        on stop_times.trip_id = trips.trip_id
)
select
    routes.route_short_name as routes_name,
    count(routes.stop_id) as total
from stops_routes
group by routes_name
order by total desc;

-- Linted with sqlfluff
Now we get a nice table with the results. Then we can run some queries and extract some answers like the fact that the average number of stops are 70 and that it can go as little as 21 (routes 920 and 910) to 121 (routes 508 and 603).
select avg(total) from route_stops;
select min(total) from route_stops;
select max(total) from route_stops;

-- To get exactly which routes have the fewer and most stops respectivelly
select * from route_stops order by total asc limit 10;
select * from route_stops order by total desc limit 10;
What is the frequency of the buses?
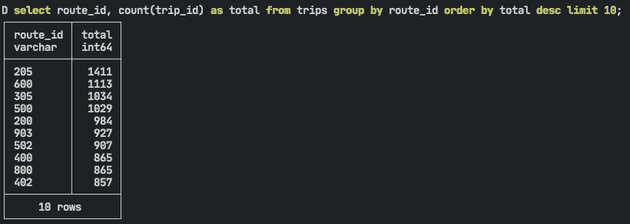
To answer this question we can look at the trips table.
select
    route_id,
    count(trip_id) as total
from trips group by route_id order by total desc limit 10;
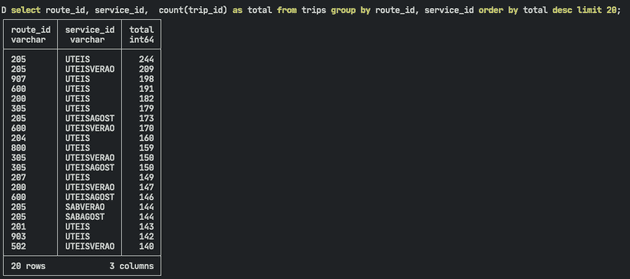
This is all nice, but it would be more useful if we distributed the trips by the different periods. To keep it simple, we can use the service_id which defines the “type” of weekday:
- UTEISAGOST: weedkday in august
- DOMAGOST: sunday august
- UTEIS: weekday
- DOM: Sunday
- SAB: Saturday
- SABVERAO: Saturday during summer
- DOMVERAO: Sunday during summer
- UTEISVERAO: weekday during summer
select
    route_id,
    service_id,
    count(trip_id) as total
from trips group by route_id, service_id order by total desc limit 10;
Now we get something more interesting to analyze. Route 205 is the most frequent on work days by far. Another route of note is 907 which is the second most frequent route on work days but during weekends it disappears from the top 20. This seems to indicate that it’s mostly a route for workers.
Conclusion
In this post, I’ve tried to show how we could use Duckdb for local analysis with only some knowledge of SQL. It can empower analysts and data engineers as we can focus on the problem at hand as SQL is a declarative language instead of an imperative one. There are many other features I’m hoping to test and in the future, I’ll try to show features like:
- Employing DuckDB on a jupyter notebook
- Read from an S3 and a postgres instance
- Integration with Metabase, dbt, airflow, etc

I'm José Cabeda, a data engineer focused on improving data systems and educating on how to use them. I also do a lot of planning and read as much as I can.


